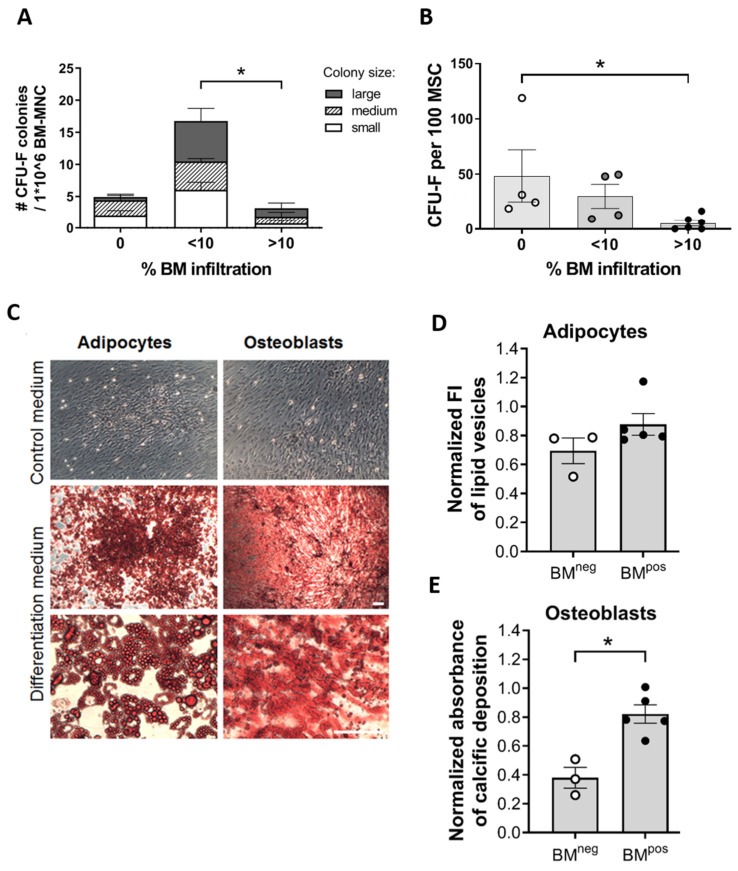
Figure 3.
The MSC compartment of metastatic BM is characterized by a lower CFU-F capacity per 100 MSCs and an increased differentiation potential towards osteoblasts. (A,B) The clonogenic potential of MSCs was determined by a Colony-forming unit-fibroblast (CFU-F) assay to determine the frequency of stromal progenitors. BM infiltration is determined by qPCR. (A) Average colony number per 1 × 10⁶ MNCs of BM as well as colony size from NB-patients with and without BM metastases. Experiments were carried out in triplicate. (B) number of colonies per 100 MSC for NB-patients with and without BM metastases. (C–E) Differentiation capacity of MSCs. (C) MSCs isolated from BM of localized- and metastatic-NB patients and adult BM, were assayed for their differentiation capacity. After 3 weeks of culturing in the respective differentiation medium, cells were stained for lipid vesicles of adipocytes (using Oil red O) or for calcium deposits, as an indicator of osteogenesis (Alizarin Red S), and nuclei (Hoechst). Scale bar = 50 µm (D,E) Quantification of differentiated cells. Metastatic disease in the BM is defined based on qPCR positivity as BMpos and qPCR negativity as BMneg (D: adipocytes, E: osteoblasts). (*) p < 0.05.

