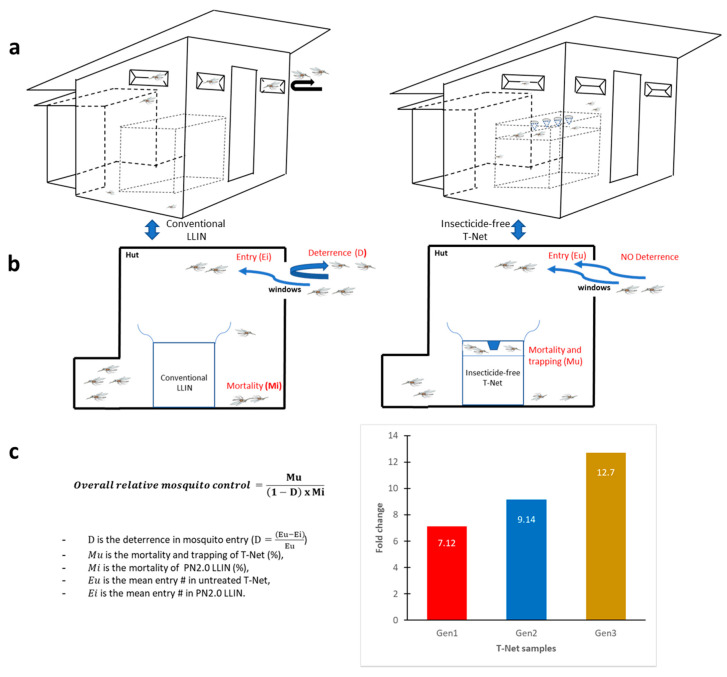
Figure 4.
Overall relative mosquito control. (a) Schematic illustration of the experimental hut with either a LLIN or a free-insecticide T-net, (b) the different parameters used to define the model, and (c) overall relative mosquito control. The histograms show the increased mosquito mortality for Gen1, Gen2, and Gen3 T-Nets compared to the PN2.0-LLIN.

