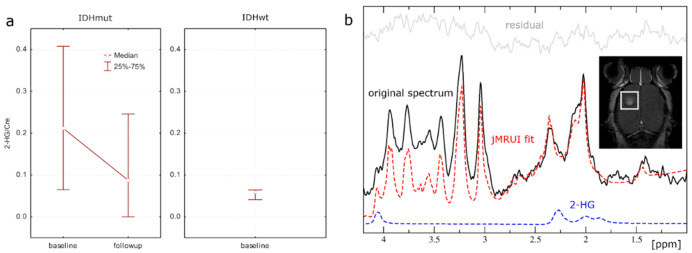
Figure 2.
(a) Median and 25–75% interquartile measurements of tumor 2-HG/tCr ratios in the LNT-229 IDH1-R132H model at baseline and follow-up. (b) Representative murine, in vivo single voxel 1H-MRS spectrum for tumor tissue with IDH mutation at 7T. T2 weighted images and T1 weighted images with contrast (figure) were used for voxel placement. MRS data include original spectrum, spectral fit, residual, and the individual component 2-HG.

