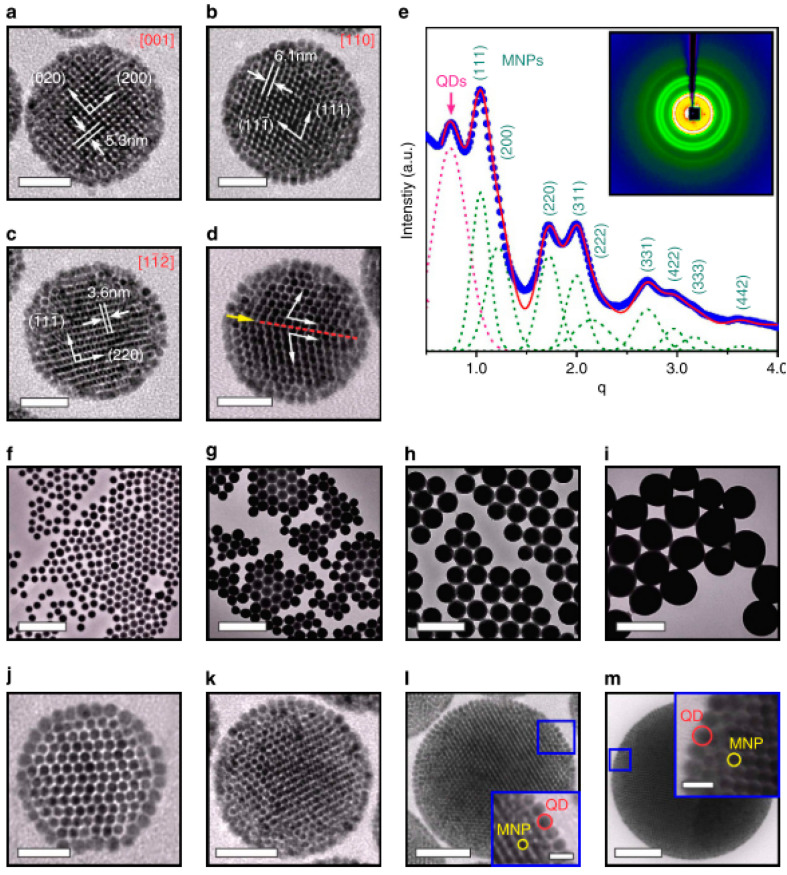
Figure 21.
Supercrystalline CS-SPs (core–shell supernanoparticles) and their size-controlled syntheses. TEM images of supercrystalline CS-SPs viewed along different zone axes (a) (0 0 1), (b) (1 1 0) and (c) (1 -1 -2) (d) TEM image of a CS-SP with a stacking fault marked with a yellow arrow. Scale bars, 50 nm (a–d). (e) The integrated data from the SAXS pattern (inset) of CS-SPs show a position ratio series of q/q0 = 1/√(4/3)/√(8/3)/√(11/3)/√(4)/√(19/3)/√(8)/√(9)/√(12) (q0 is the position of the (111) peak) indicating an fcc close packing of the MNPs. Large-area TEM images (f–i) and higher magnification TEM images (j–m) of CS-SPs with an average diameter of 80 ± 9 nm (f,j), 120 ± 13 nm (g,k), 235 ± 30 nm (h,l), and 360 ± 60 nm (i,m). The insets in l and m are the position of the (111) peak, q = 4πsinθ/λ, indicating an fcc close packing of the MNPs. Large-area TEM images (f–i) and higher-magnification TEM images zoomed-in images of the blue squares. Scale bars, 500 nm (f–i). Scale bars, 30 nm, 50 nm, 70 nm and 100 nm (j–m), respectively. Scale bars, 15 nm (insets of l and m). Red and yellow circles indicate the positions of QDs and MNPs, respectively. (Reprinted by permission from Copyright Clearance Center: Spinger Nature, Nature Communications, [144], Copyright 2014).

