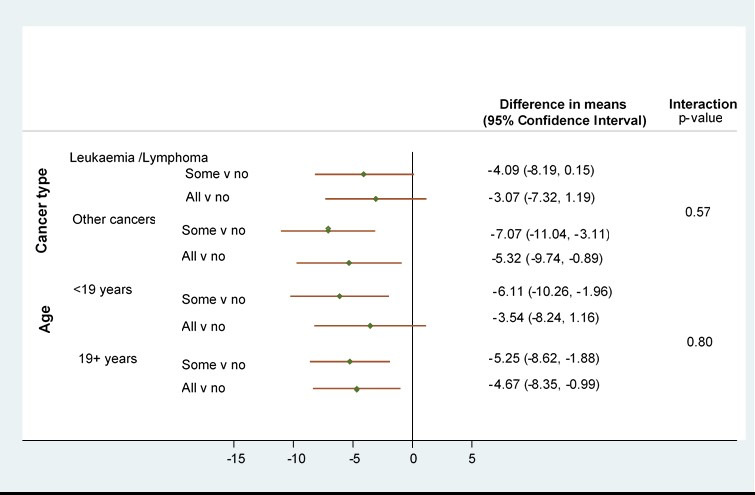
Figure 3.

Subgroup investigations for cancer type (leukaemia/lymphoma v other) and age group (<19 v 19+): Results from adjusted* random effects models with interaction terms (n=733). *Model with a random effect for city and adjustment for time since diagnosis, age at diagnosis, type of cancer, socioeconomic status, severity of cancer, ethnicity, choice about where to receive treatment, long-term condition prior to cancer, days from first symptom to diagnosis, number of general practitioner visits before diagnosis. v, versus.
