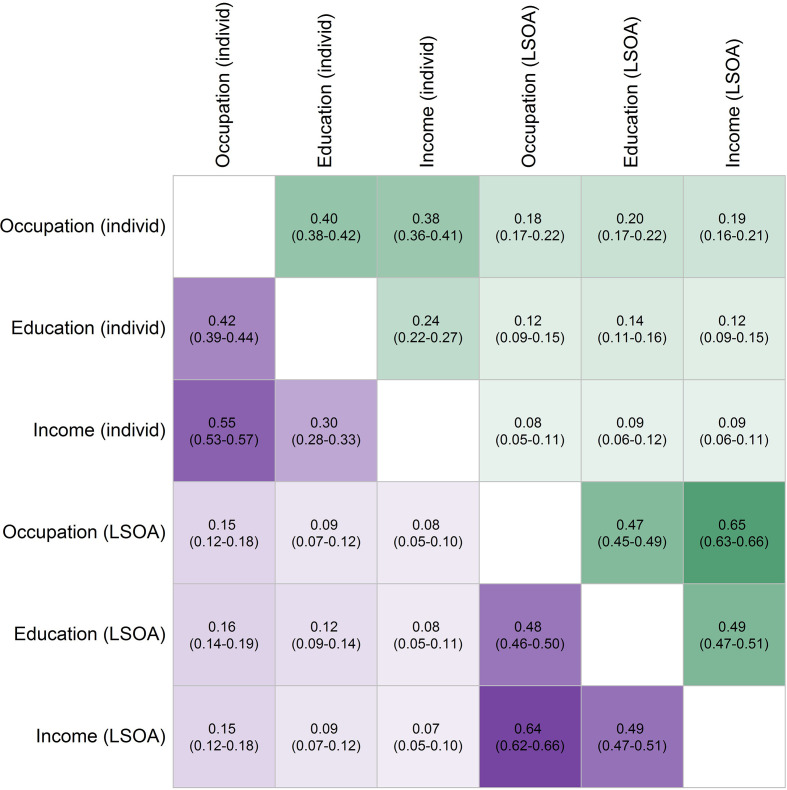
Figure 2.
Cramer’s V±95% CI for all pairwise combinations of deprivation metrics. Strength of concordance is indicated by darker shading for men in top half (green; n=4826), and women in bottom half (purple; n=4721). Data source: ONS LS. Individ, individual; LSOA, Lower-level Super Output Area; ONS LS, Office for National Statistics Longitudinal Study.

