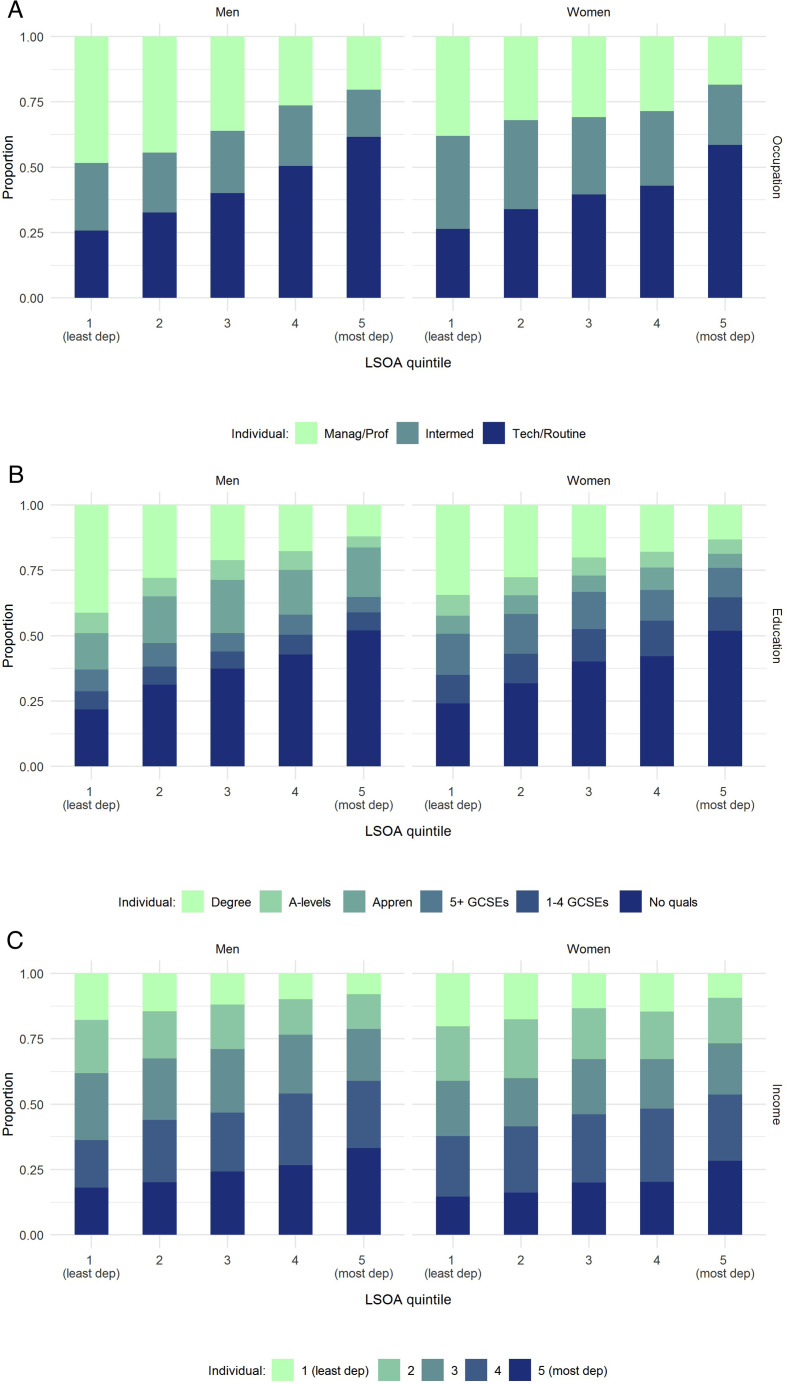
Figure 3.
Stacked barplots showing proportions of men and women in each combination of categories for (A) individual occupation versus LSOA occupation quintiles; (B) individual education versus LSOA education quintiles; and (C) individual income versus LSOA income quintiles. Data source: ONS LS. Appren, Apprenticeship; dep, deprived; GCSE, General Certificate of Secondary Education; Intermed, Intermediate; LSOA, Lower-level Super Output Area; Manag/Prof, Managerial/Professional; ONS LS, Office for National Statistics Longitudinal Study; Quals, qualifications; Tech/Routine, Technical/Routine

