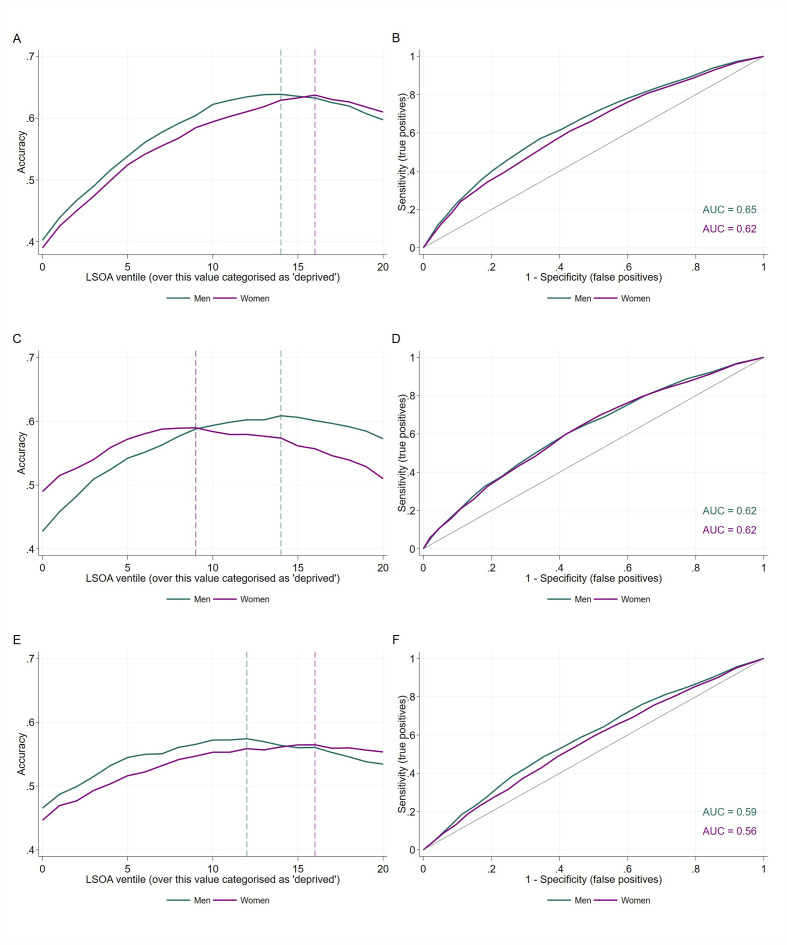
Figure 4.
Predictive accuracy of LSOA-level variables to predict deprived/not deprived individual deprivation status (left); and ROC curves (right) plotted as sensitivity (true positive rate) against 1-specificity (false positive rate). A/B: occupation; C/D: education; and E/F: income. Dashed lines indicate LSOA ventile value with maximum predictive accuracy when used as the threshold value to differentiate between deprived/not deprived, where deprived are those above this threshold. AUC values are shown next to ROC curves. Data source: ONS LS. AUC, area under the curve; LSOA, Lower-level Super Output Area; ONS LS, Office for National Statistics Longitudinal Study; ROC, receiver operating characteristic

