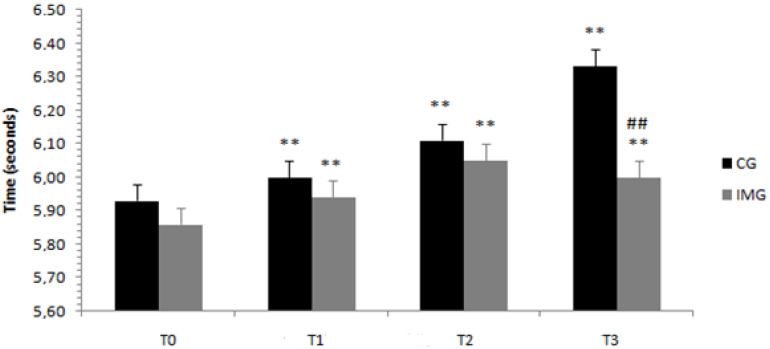
Figure 4.
Means and standard deviations of the ZIG-ZAG test scores, before, at the beginning, in the middle, and at the end of Ramadan for the two groups (control group, CG, versus experimental group, imagery training group or IMG). CG = control group, IMG = imagery training group. ## Significantly different from the control group at p < 0.001. ** Significantly different from before Ramadan at p < 0.001.

