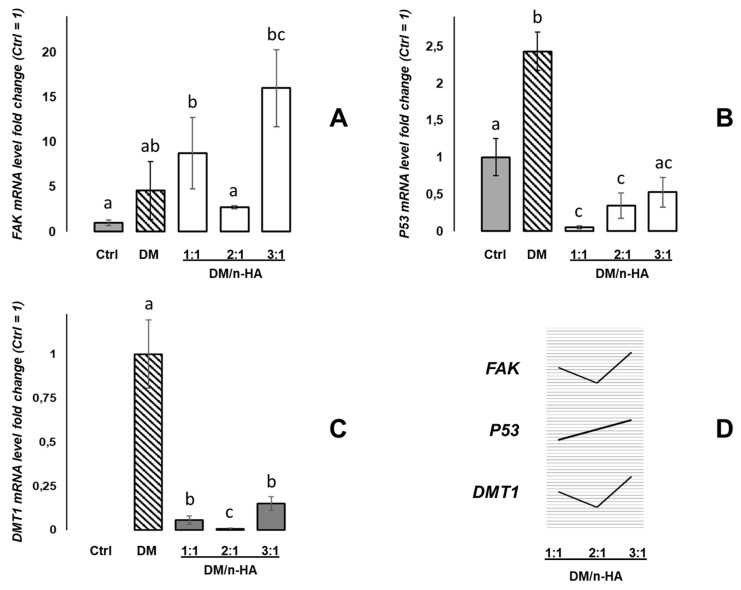
Figure 2.
mRNA expression analysis by qPCR in MG63 cells grown in the absence and presence of the 5 µg/mL DM and DM/n-HA (1:1, 2:1, 3:1) for 48 h. The amounts of each target mRNA of the FAK (A), P53 (B) and DMT1 (C) genes were calculated as 2−ΔCt values obtained from the real-time PCR assays. Ct values of the detected mRNA targets were normalized with respect to the 28S RNA housekeeping gene, and were expressed as fold change (y-axis) with respect to the control mean values (Ctrl = 1) except for (C), where data are expressed as fold change with respect to the DM value (DM = 1). Statistical analysis of variance of the means was assessed by one-way ANOVA and Bonferroni post-hoc test [n = 4; histograms (mean values) with a common letter are not significantly different with p < 0.05 level of significance; histograms (mean values) not sharing any letter are significantly different with p < 0.01 level of significance]. In (D) graphic summary of the three mRNA expression trends reported for the DM/n-HA 1:1, 2:1, 3:1 experimental conditions.

