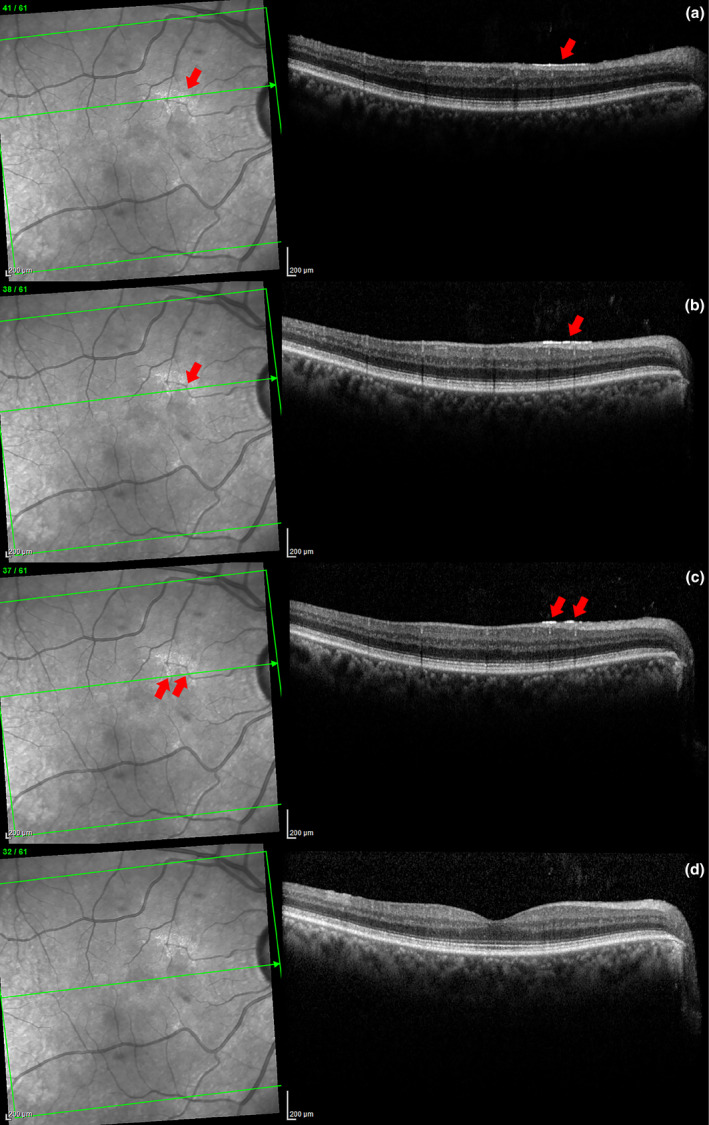
Figure 3.

Series of SD‐OCT scans of a patch of ARAM in a glaucoma patient (a through c). On the left, the patchy glistening ARAM can be clearly visualized in the SLO image. On the right, a corresponding hyper‐reflective line at the ILM can be seen in the same location depicted by the arrows. The bottom scan (d) is inferior to the ARAM, the hyper‐reflective line is absent here.
