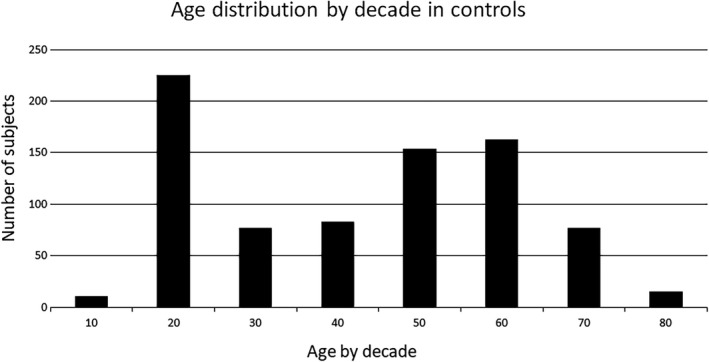
Figure 4.

The age of controls is distributed by decade. The large sample of subjects in their 20’s is due to a large number of optometry students. There was only one subject below the age of 10 and one subject who was 90, they were grouped into the next closest decade category in this and subsequent figures.
