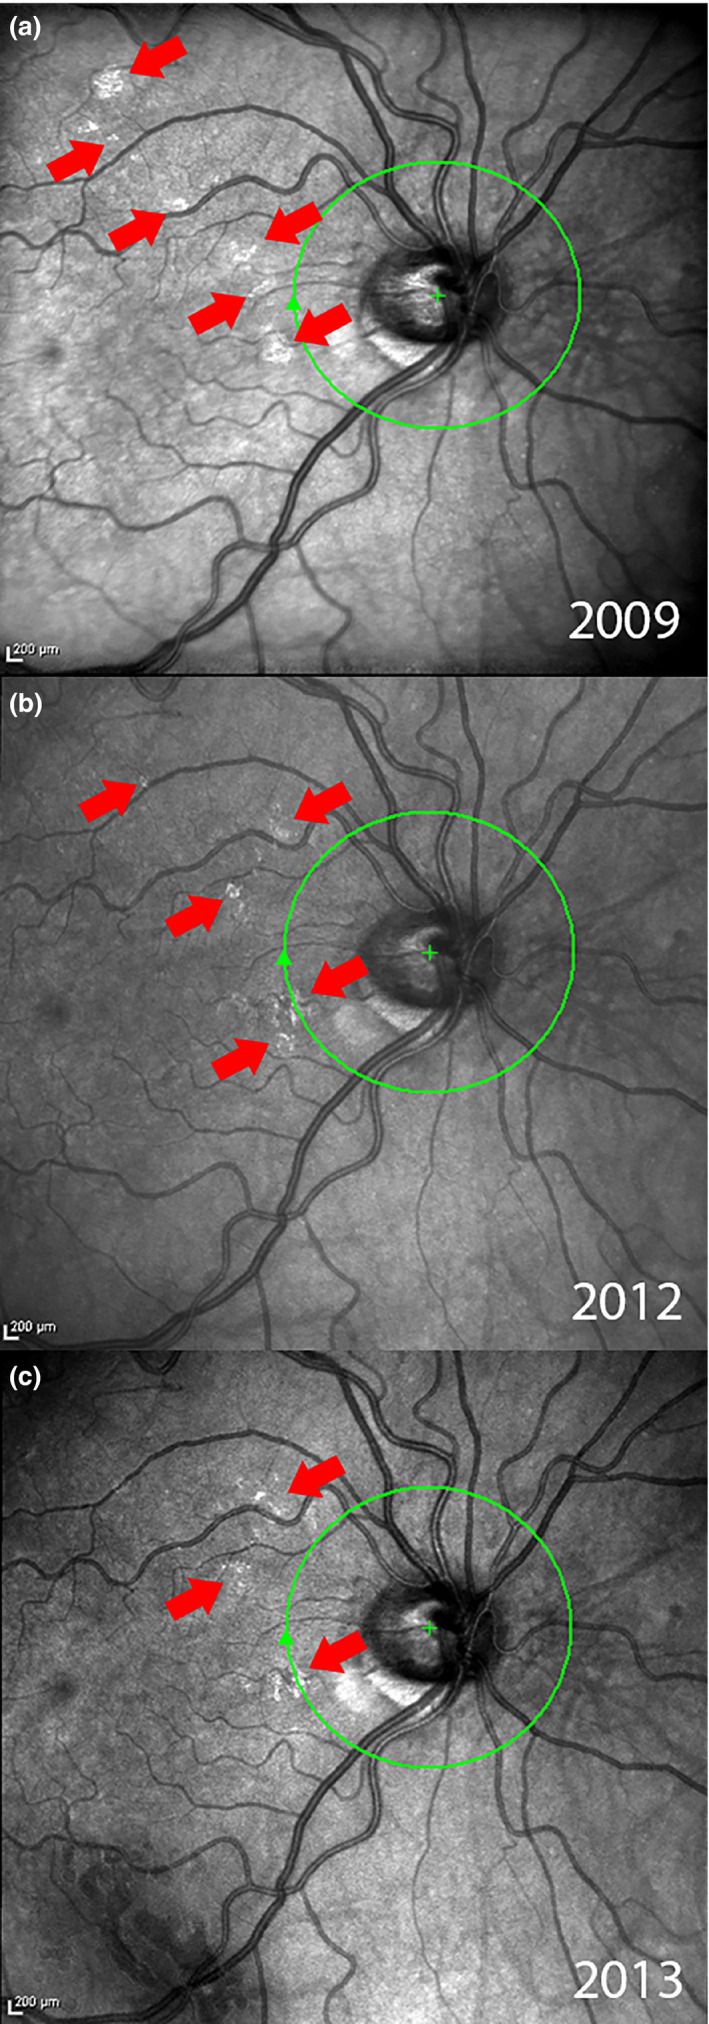
Figure 7.

Series of SLO images from the SD‐OCT of a control subject over a period of four years showing temporal changes in ARAM. (a) The initial scan taken in 2009, multiple small patches of ARAM can be seen depicted by the arrows. (b) Scan taken in 2012. Much of the ARAM in (a) has faded, with some new areas of ARAM developing. (c) Scan taken in 2013 continues to show changes in ARAM.
