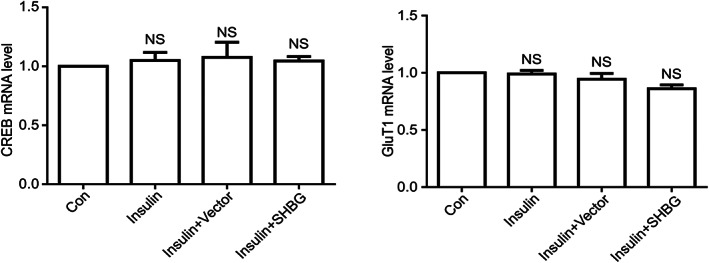
Figure 2.

Relative mRNA expression of CREB and GLUT1 in four groups of cells: normal cells, insulin resistance model cells, model cells + empty plasmid and model cells + SHBG‐overexpression plasmid. Relative mRNA levels were quantified by real‐time qPCR (means ± SD; n = 3 independent experiments; one way anova; **P < 0.05).
