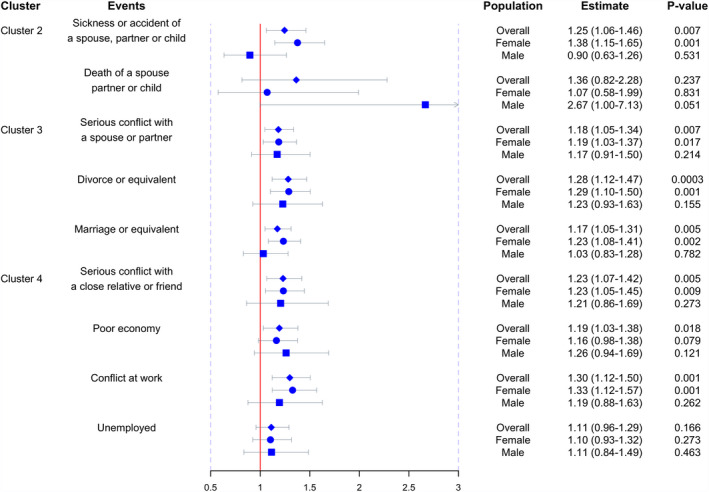
Figure 3.

The effect size of individual life events on MS. Blue diamonds and horizontal bars represent the odds ratios and confidence intervals of each individual life event with the risk of MS. Effect sizes in females and males are presented by circles and squares, respectively
