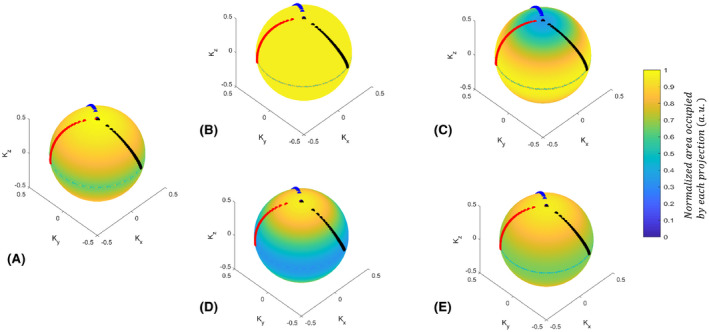
FIGURE 3.

The spatial distribution of projections on a sphere for different anisotropic FOV ratios. (A) Conventional SP, (B) VASP with a spherical FOV of 100:100:100, (C) oblate spheroid with ratio of 100:100:35, (D) prolate spheroid with ratio of 35:35:100, and (E) prolate spheroid with ratio of 68:68:100. The readout tips of the first 3 consecutive interleaves (with 34 readouts per interleave, out of 377 interleaves) are highlighted in black, red, and blue, respectively. Note: VASP with (B) isotropic FOV had a significantly more uniform distribution when compared to (A) conventional SP. The distribution of projections of (A) the conventional SP had an effective FOV of 68:68:100, and it closely matched to the readout distribution of (E)
