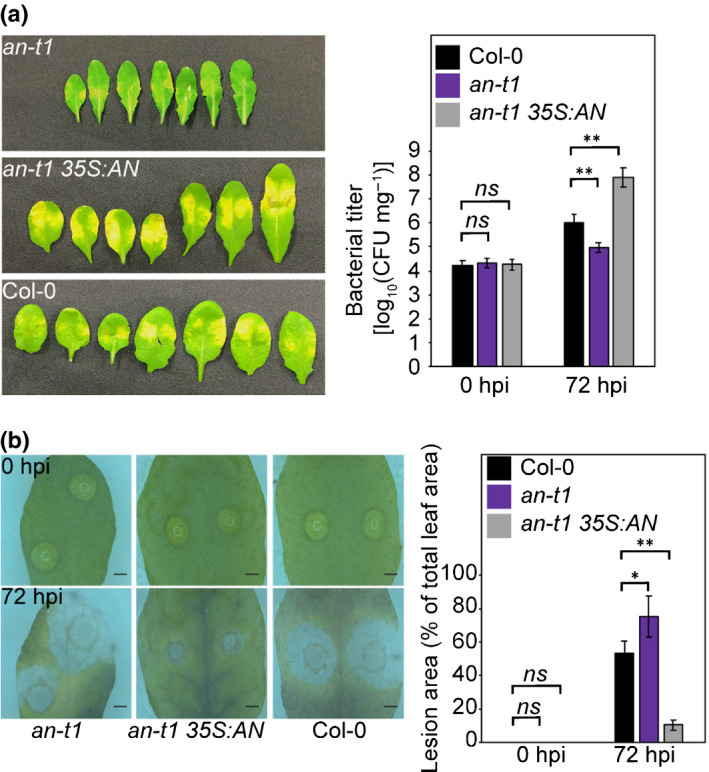
Fig. 1.

AN antagonistically regulates Arabidopsis resistance to Pseudomonas syringae and Botrytis cinerea. (a) P. syringae inoculation of Col‐0, an‐t1, and an‐t1 35S:AN. Bacteria titers in 0 h post infection (hpi) and 72 hpi are shown in the bar graph. Values represent means ± SE, n = 15. (b) B. cinerea inoculation of Col‐0, an‐t1 and an‐t1 35S:AN. Bars, 1 mm. Lesion areas (% of total leaf area) in 0 hpi and 72 hpi are shown in the bar graph. Values represent means ± SE, n = 40. Statistical significance was determined by two‐tailed Student’s t‐tests against Col‐0 (**, P < 0.01; *, P < 0.05; ns, P > 0.05).
