Fig. 2.

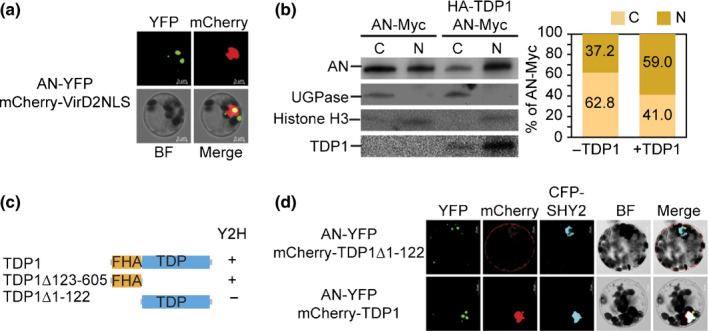
TDP1 enhances the nuclear accumulation of AN in Arabidopsis. (a) Subcellular localisation analysis showing the partial nuclear localisation of AN in the Arabidopsis protoplasts. Overlapping of AN‐YFP (green) and mCherry‐VirD2NLS (nuclear marker, red) is indicated as a yellow colour. BF, bright field. Bars, 5 µm. (b) Immunoblot analysis of the nuclear accumulation of AN with or without TDP1. AN‐Myc, HA‐TDP1, UGPase (cytosolic marker), histone H3 (nuclear marker) are examined in cytosolic (C) and nuclear (N) fractions. AN‐Myc signals were quantified using Image Lab software (Bio‐Rad) and then normalised against the corresponding nuclear or cytosolic marker to calculate the relative ratio of AN signals in cytosolic and nuclear fractions. (c) Yeast two‐hybrid analysis of the interaction between AN and TDP1. Domain structures of truncated TDP1 are displayed. ‘+’ indicates interaction; ‘−’ indicates no interaction. (d) Co‐localisation analysis of AN with full‐length TDP1 and truncated TDP1 without FHA domain (TDP1Δ1–122). CFP‐SHY2 (blue) is a nuclear marker. Bars, 10 µm.
