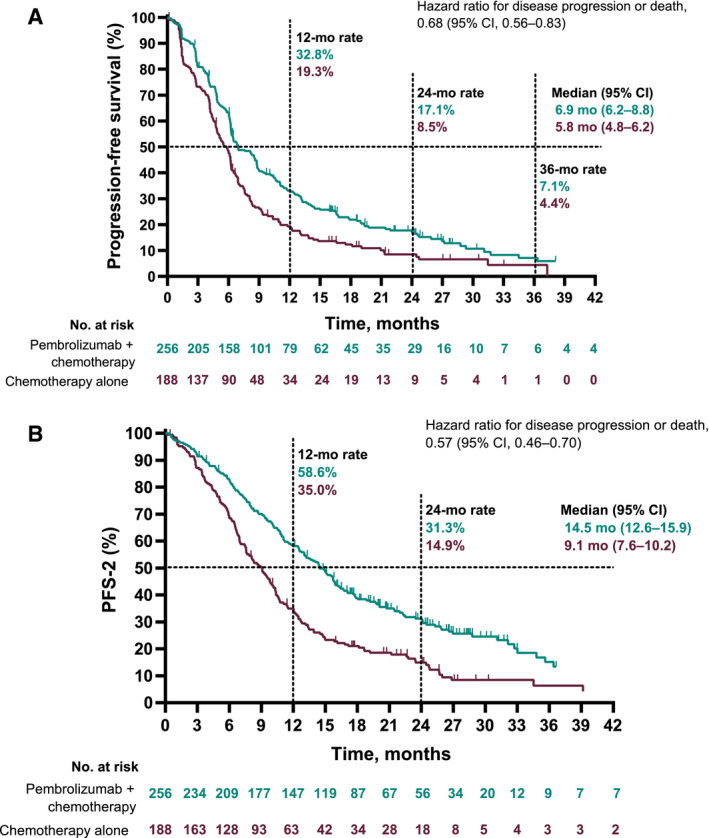
Figure 3.

Kaplan‐Meier estimates of PFS among patients with no PD‐L1 expression (TPS < 1%): (A) PFS for patients who received pembrolizumab plus chemotherapy versus chemotherapy alone and (B) PFS‐2 for patients who received pembrolizumab plus chemotherapy versus chemotherapy alone. PD‐L1, programmed death ligand 1; PFS, progression‐free survival; PFS‐2, progression‐free survival 2; TPS, tumor proportion score.
