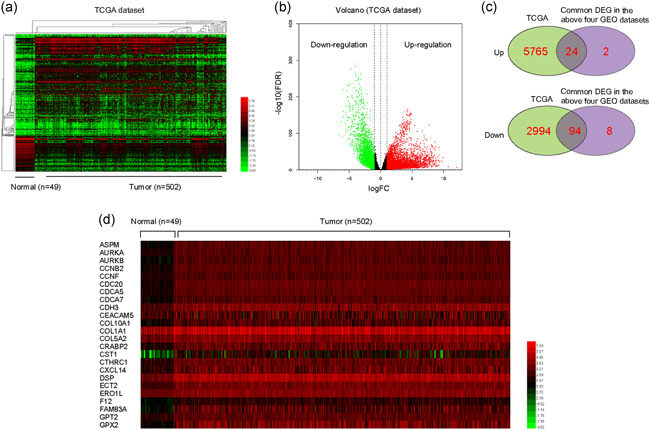
Figure 3.

The DEGs in NSCLC were analyzed using TCGA data. (a) Heatmaps of DEGs in TCGA data. The red color represented the highly expressed genes in tumor tissues and the green color represented the low expression genes. (b) Volcano map of DEGs in TCGA data. (c) Venn diagrams of up‐ or downregulated genes in the above analysis. (d) The heatmap of these 24 genes expression in NSCLC (using TCGA data). DEGs, differentially expressed genes; GEO, Gene Expression Omnibus; NSCLC, non‐small cell lung cancer; TCGA, The Cancer Genome Atlas
