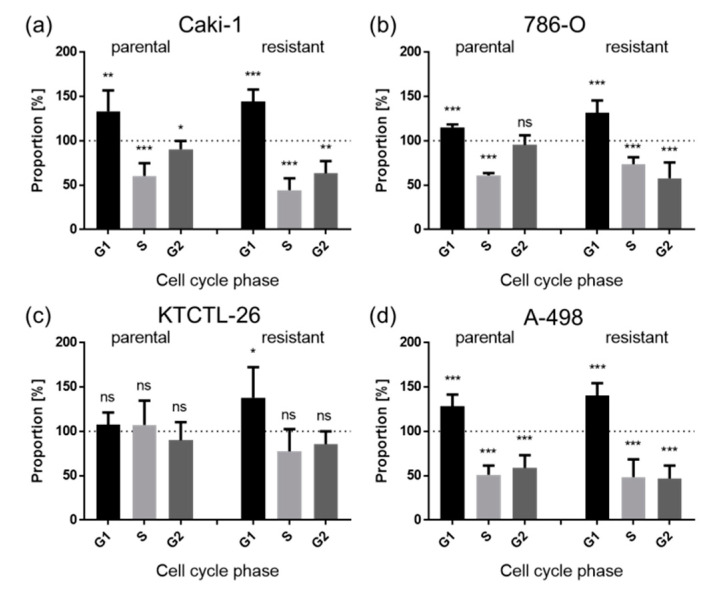
Figure 4.
Distribution of cell cycle phases: Proportion of parental and sunitinib-resistant RCC cells, Caki-1 (a), 786-O (b), KTCTL-26 (c), and A-498 (d), in the G0/G1, S, and G2/M phases after 48 h treatment with ART (20 µM). Untreated cells served as controls (dotted line; set to 100%). Error bars indicate standard deviation (SD). Significant difference to untreated control: * p ≤ 0.05, ** p ≤ 0.01, *** p ≤ 0.001, ns = not significant. n = 5.

