Figure 9.
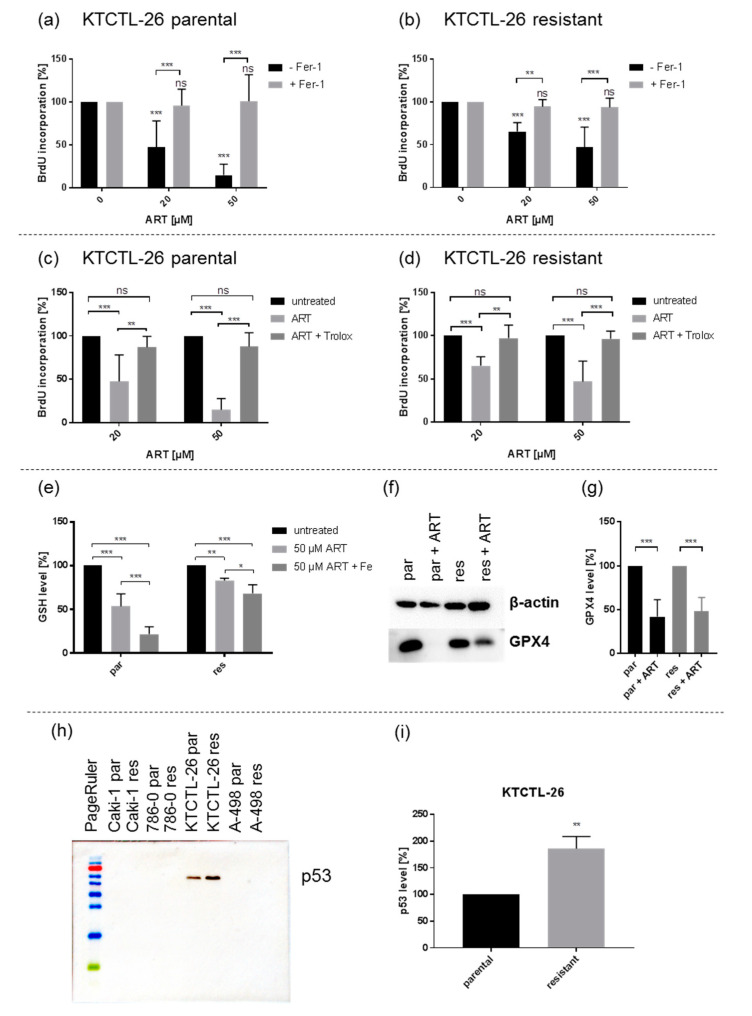
Artesunate induced ferroptosis by reactive oxygen species (ROS) formation in p53-positive KTCTL-26 cells: Ferroptosis induction (a,b) Proliferation of parental (a) and sunitinib-resistant KTCTL-26 cells (b) treated for 48 h with ART (20, 50 µM) and ferrostatin-1 (Fer-1) (20 µM). Untreated (100%) and ART mono-treated cells served as controls. Error bars indicate standard deviation (SD). Significant difference compared to untreated controls, except for asterisk brackets indicating significant difference between ferrostatin-1 untreated and treated cells: * = p ≤ 0.05, ** = p ≤ 0.01, *** = p ≤ 0.001, ns = not significant. n = 5. Indications of ROS generation (c–g): Proliferation of parental (c) and sunitinib-resistant KTCTL-26 cells (d) treated for 48 h with ART (20, 50 µM) and Trolox (0.5 mM). Untreated cells served as controls (100%). n = 5. GSH level (%) of parental (par) and resistant (res) KTCTL-26 cells after 24 h incubation with ART (50 µM) and holo-transferrin (Fe) (e). Untreated controls served as controls (100%). n = 5. GPX4 expression: Representative Western blot of GPX4 expression in parental (par) and sunitinib-resistant (res) KTCTL-26 cells after 48 h exposure to ART (50 µM) (f). Pixel density analysis of GPX4 level (%) after 48 h exposure to ART (50 µM) in parental (par) and resistant (res) KTCTL-26 cells (g). Untreated cells served as controls (100%). β-actin served as internal control. n = 5. Protein expression of p53 (h,i) Representative Western blot analysis of p53 in parental (par) and resistant (res) Caki-1, 786-O, KTCTL-26, and A-498 cells (h). Pixel density analysis of p53 expression in parental (100%) and resistant KTCTL-26 cells (i) p53 protein analysis was accompanied and normalized by a total protein control. n = 3. Error bars indicate standard deviation (SD). Significant difference indicated by: * p ≤ 0.05, ** p ≤ 0.01, *** p ≤ 0.001, ns = not significant. For detailed information regarding the Western blots of (f) and (h) see Figures S3 and S4.

