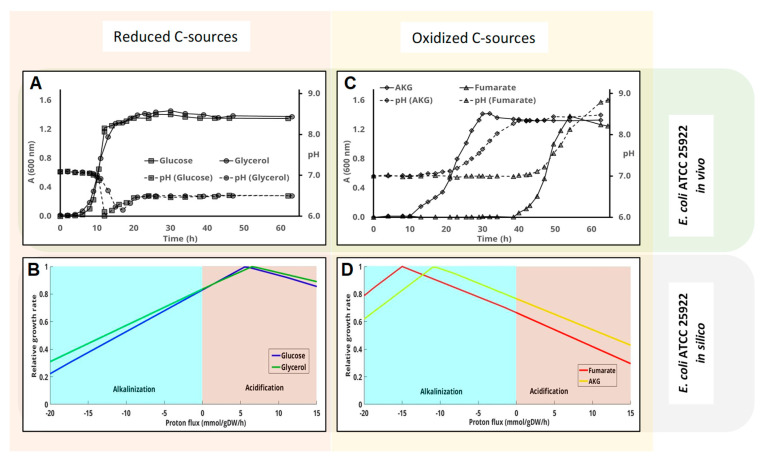
Figure 2.
Influence of the carbon source on the pH change in E. coli ATCC 25,922 cultures. Cells were inoculated in M63 media containing different carbon sources. Cell-growth (solid lines-A(600 nm)) and pH change (dashed lines) were measured at the indicated times. Glucose and glycerol, which are considered reduced carbon sources, are plotted together (panel (A)), whereas panel (C) shows the results obtained using the more oxidized carbon source fumarate and 2-oxoglutarate. Panels (B,D) represent the predicted influence of proton flux (negative implies uptake and therefore alkalinilization of the medium) on the growth rate using the genome scale metabolic model of this strain as indicated in the Materials and methods section.

