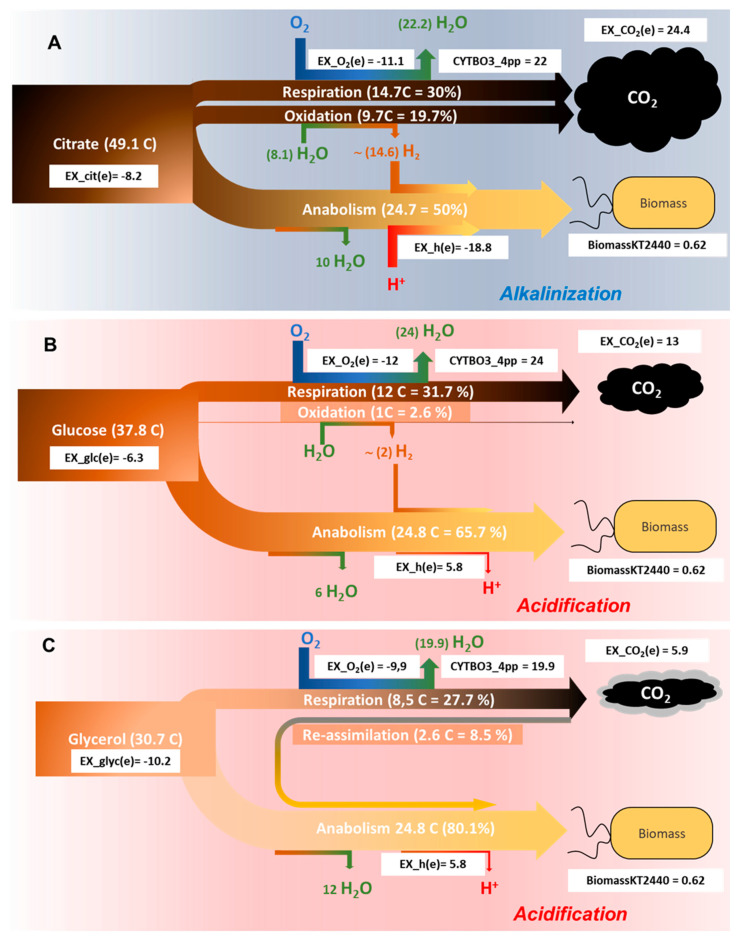
Figure 5.
Carbon-flow distribution in P. putida 2440 (iJN1411) as a function of the carbon source. Cell growth (biomassKT2440) was normalized as indicated in M&M. The white rectangles represent the normalized flow through the indicated reactions. The total amount of citrate (A), glucose (B), or glycerol (C) is divided into two main streams, one rendering biomass (anabolism, lower part of each scheme) or CO2 (catabolism, upper part). The percentage and number of carbons through respiration was calculated from the consumed O2 (ex_o2(e)) according to Table 1. The difference between the produced CO2 (ex_co2(e)) and that expected from respiration (Table 1) is re-assimilated in the case of glycerol (C) or oxidized according to Table 2, rendering reducing power. CYBO3_4pp: Cytochrome c oxidases, bo3-type).

