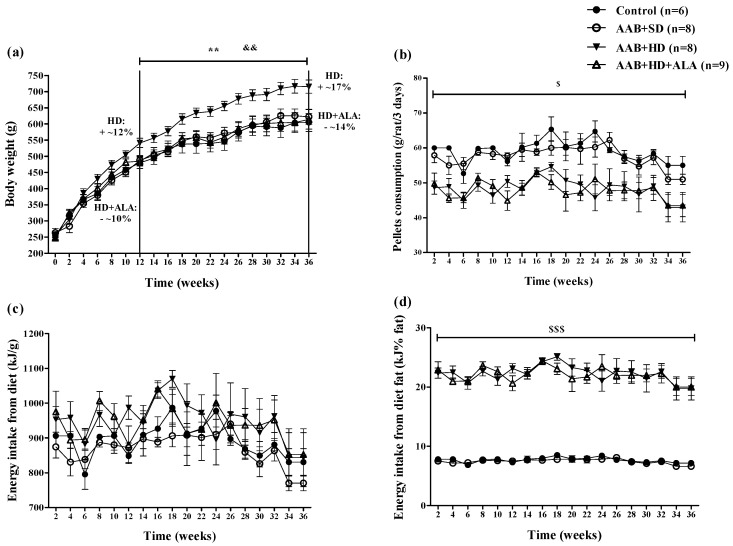
Figure 2.
Evolution of (a) Body weight, (b) Pellets consumption (g/rat/3 days), (c) Energy intake from diet (kJ/g) and (d) Energy intake from diet fat (kJ% fat) in the 4 groups of rats evaluated. ** p < 0.01: AAB + HD vs. AAB + SD and Control groups; && p < 0.01: AAB + HD + ALA vs. AAB + HD; $ p < 0.05, $$$ p < 0.001: AAB + HD and AAB + HD + ALA vs. Control and AAB + SD (two-factor repeated measures ANOVA).

