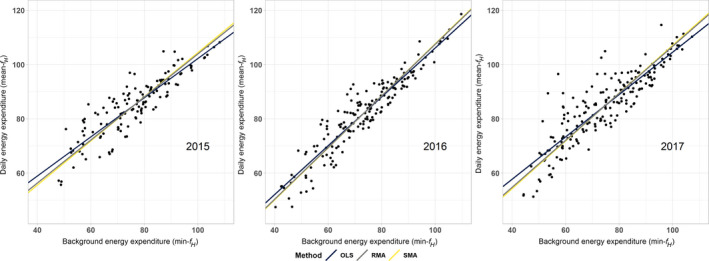
FIGURE 2.

Grey seal energy management over lactation. Across‐individual relationships between daily values of mean‐fH (daily energy expenditure) against daily values of min‐fH (daily background energy). Relationships estimated using ordinary least squares (OLS; black line), ranged major axis (RMA; grey line) and standard major axis (SMA; yellow line) regression methods, illustrating varying degrees of regression dilution. OLS regression regularly appears to underestimate the true relationships between these variables since error likely exists in both sets of variables. As a population, a slope of <1 was found for each season of study indicating a compensation energy management strategy
