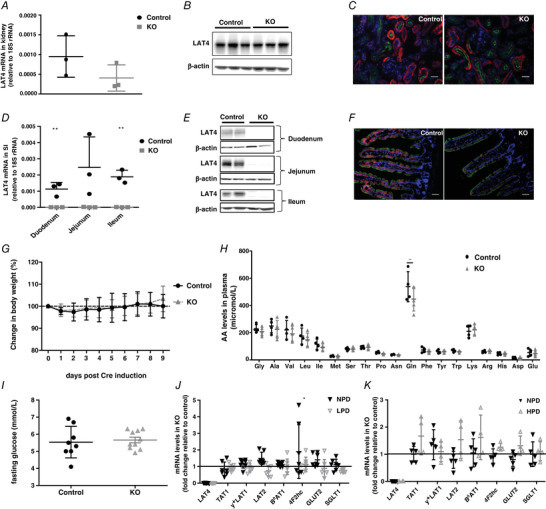
Figure 2. Characterization of the global LAT4 KO induced past the postnatal phase.

A–C, LAT4 KO in the kidney was almost 50% efficient at the mRNA level (A) but negligible at the protein level as observed by WB (B) and IF (C). Basolateral LAT4 is shown in red, luminal B0AT1 (SLC6A19) in green and nuclei in blue (DAPI). Scale bars = 50 μm. D–F, LAT4 KO efficiency in the SI was almost 98% efficient at both the mRNA (D) and protein levels (E and F). Labelling of colours for IF is as indicated in (C). Scale bar = 10 μm. G, changes in body weight expressed as a percentage. Fasting (H) AA concentrations and (I) glucose levels in plasma. J and K, relative gene expression of other known basolateral and luminal neutral AA and glucose transporters in KO mice subjected to TRF with (J) normal (NPD) or low (LPD) protein diet (in LAT4f/f Rosa26‐CreERT2+ mouse model) and (K) normal (NPD) or high protein diet (HPD) (in LAT4f/f Villin‐CreERT2+ mouse model). Values are normalized to those of control mice within each group. Data are shown as the mean ± SD (n = 3–10). D, unpaired Student's t test. H, one‐way ANOVA with a Bonferroni post hoc test. J, two‐way ANOVA with a Bonferroni post hoc test, * P < 0.05; ** P < 0.01.
