Figure 2.

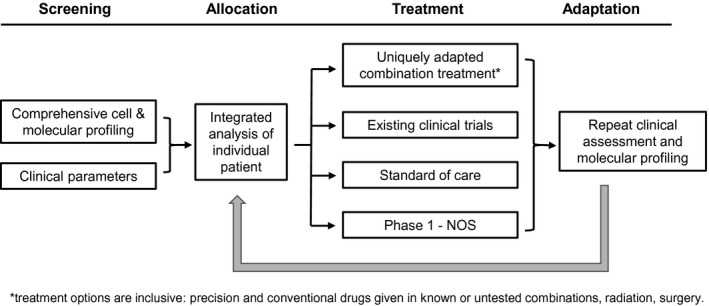
Schematic diagram of the Serial Measurements of Molecular and Architectural Responses to Therapy clinical trial platform. NOS, not otherwise specified.

Schematic diagram of the Serial Measurements of Molecular and Architectural Responses to Therapy clinical trial platform. NOS, not otherwise specified.