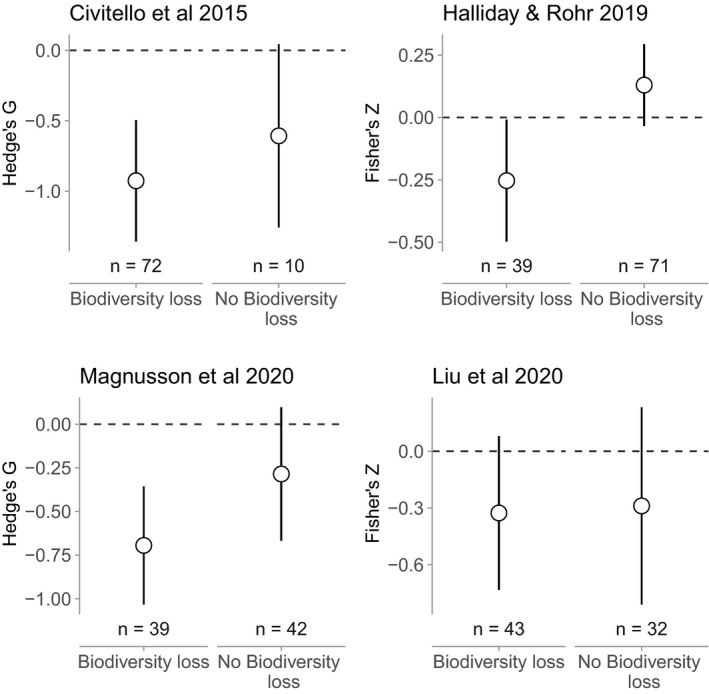
Figure 3.

Effect of biodiversity loss on the dilution effect after excluding experiments. Panels correspond to different databases. Y‐axes are standardised effect sizes, with values below zero corresponding to negative effects (i.e., dilution). Points are model‐estimated means, and error bars are model‐estimated 95% confidence intervals. With the exception of Liu, which was sensitive to study design, the dilution effect is robust across biodiversity gradients driven by biodiversity loss, but this effect is idiosyncratic across diversity gradients that do not involve biodiversity loss, even after excluding experiments.
