Figure 1.

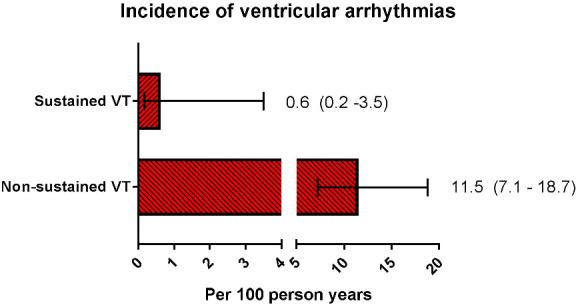
Bar graphs with 95% confidence intervals showing the incidence of sustained and non‐sustained ventricular tachyarrhythmias (VT).

Bar graphs with 95% confidence intervals showing the incidence of sustained and non‐sustained ventricular tachyarrhythmias (VT).