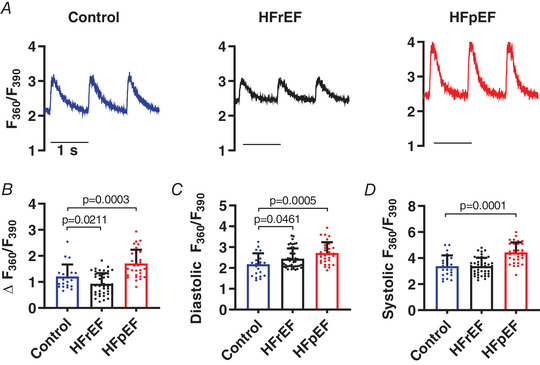
Figure 2. Calcium transients are reduced in HFrEF but enhanced in HFpEF.

A, representative fura‐2 Ca2+ transients (F 360/F 390) elicited by field stimulation at 1 Hz in cardiomyocytes isolated from control, HFrEF and HFpEF animals. B–D, pooled data analysing the amplitude (Δ), diastolic and systolic fura‐2 ratios (n = 23, 44 and 32 cells from 3 control, 5 HFrEF and 5 HFpEF rats). Results are shown as means + SD. Statistics are calculated by one‐way ANOVA. [Color figure can be viewed at wileyonlinelibrary.com]
