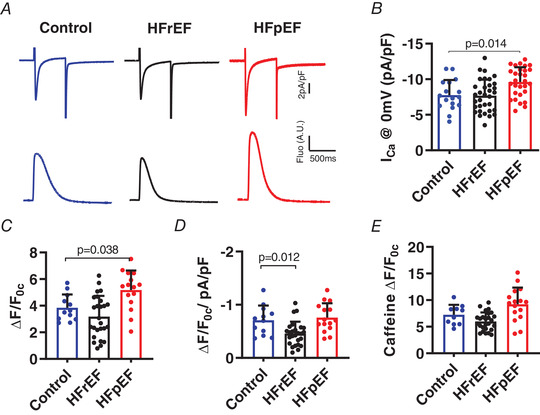
Figure 3. Excitation‐contraction coupling is defective in HFrEF and enhanced in HFpEF.

A, simultaneous recordings of I Ca,L (upper) and fluo‐4 CaTs (lower) upon depolarisation to 0 mV. B and C, pooled results for I Ca,L amplitude from 7 control, 6 HFrEF and 9 HFpEF rats (B), and triggered CaT amplitude (ΔF/F 0c) (C). D, EC coupling gain expressed as amplitude of the CaT (ΔF/F 0c) divided by peak I Ca (pA pF−1) at 0 mV. E, summary plots of CaT (ΔF/F 0c) induced by caffeine (10 mm) to assess SR Ca2+ stores. Results are shown as means + SD. Statistics are calculated by one‐way analysis of variance (ANOVA). [Color figure can be viewed at wileyonlinelibrary.com]
