
Figure 1.
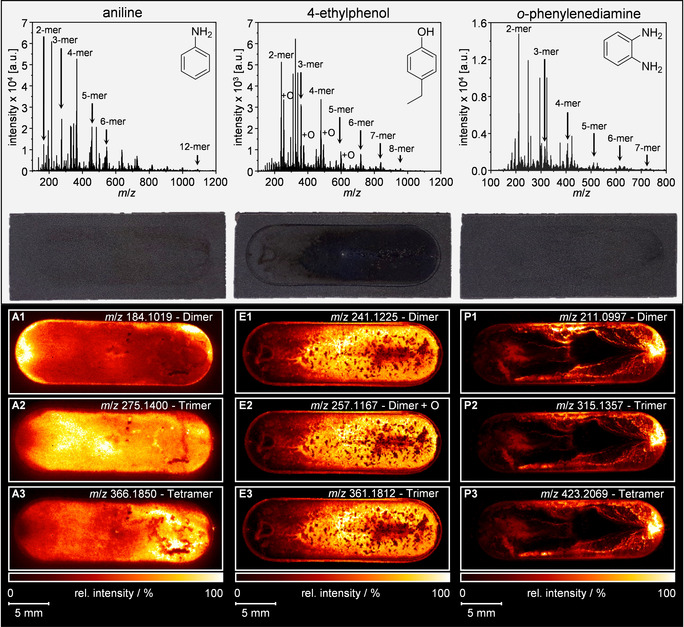
General: The results for the three compounds are presented column‐wise. Top row: Mean mass spectra for each BDD electrode of the three investigated compounds. Second row: Photographic images of the three electrodes after the electrochemical treatment. Below: (MA)LDI‐MS images of the spatial oligomer distribution of oxidative polymerized aniline (A1–3), 4‐ethylphenol including one hydroxylated compound (E1–3) and o‐phenylenediamine (P1–3). The flow direction for the electrochemical conversion is from the left to the right.