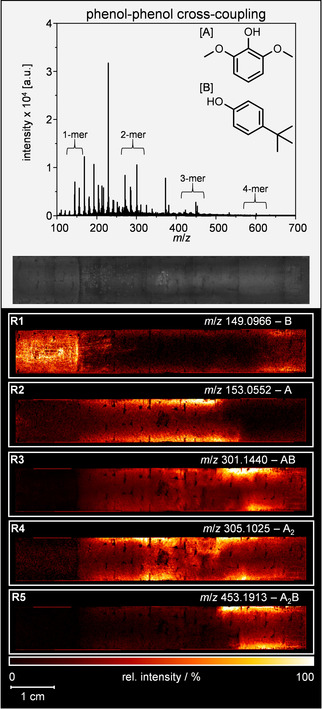
Figure 2.

Mean mass spectrum (negative ion mode) for the BDD electrode of the phenol‐phenol cross‐coupling reaction. Optical image of the electrode after electrochemical treatment. Below: Selected LDI‐MS images of the spatial monomer and oligomer distribution of oxidatively treated 2,6‐dimethoxyphenol (A) and 4‐(1,1‐dimethylethyl)‐phenol (B; R1–5). The flow direction for the electrochemical conversion is from the left to the right.
