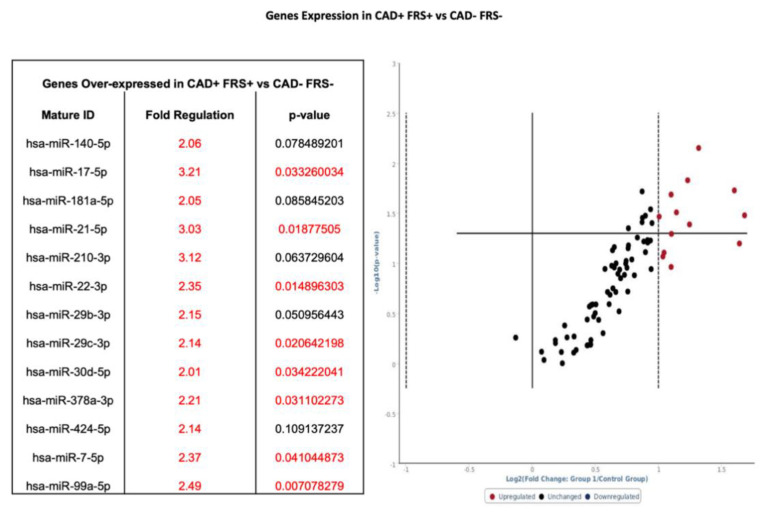
Figure 4.
Volcano plot with corresponding table showing the comparison of miRNA assessed by microarray (84 genes) isolated from patients with CAD and FRS > 18 (n = 9) versus heathy controls without CAD and FRS < 5 (n = 9). Designation of significance (RED) was given to samples with fold change >2. Samples with p values < 0.05 and fold change >2 are found in the upper right quadrant. CAD—Coronary Artery Disease. FRS—Framingham Risk Score.

