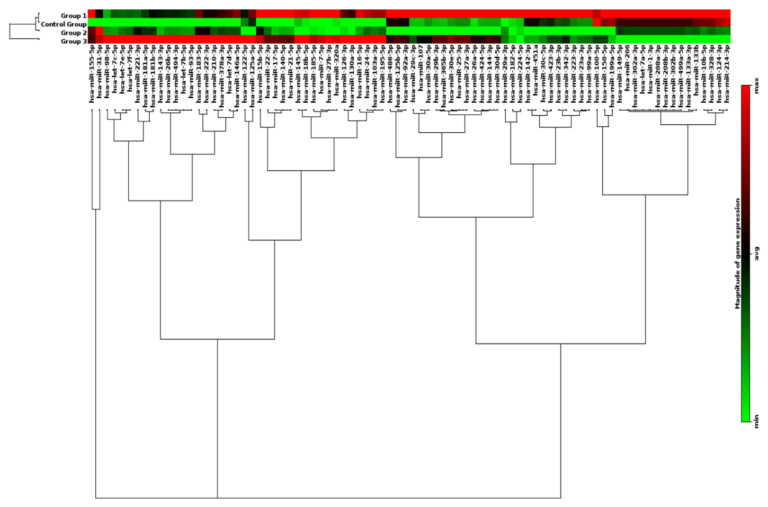
Figure 7.
Profile of circulating miRNAs in CAD patients. MiRNA Heat Map illustrates differential expression between groups stratified by the presence or absence of CAD and risk assessment by FRS. Color intensity is scaled within each row such that the highest expression value corresponds to bright red, and lowest to bright green. CAD—Coronary Artery Disease. FRS—Framingham Risk Score.

