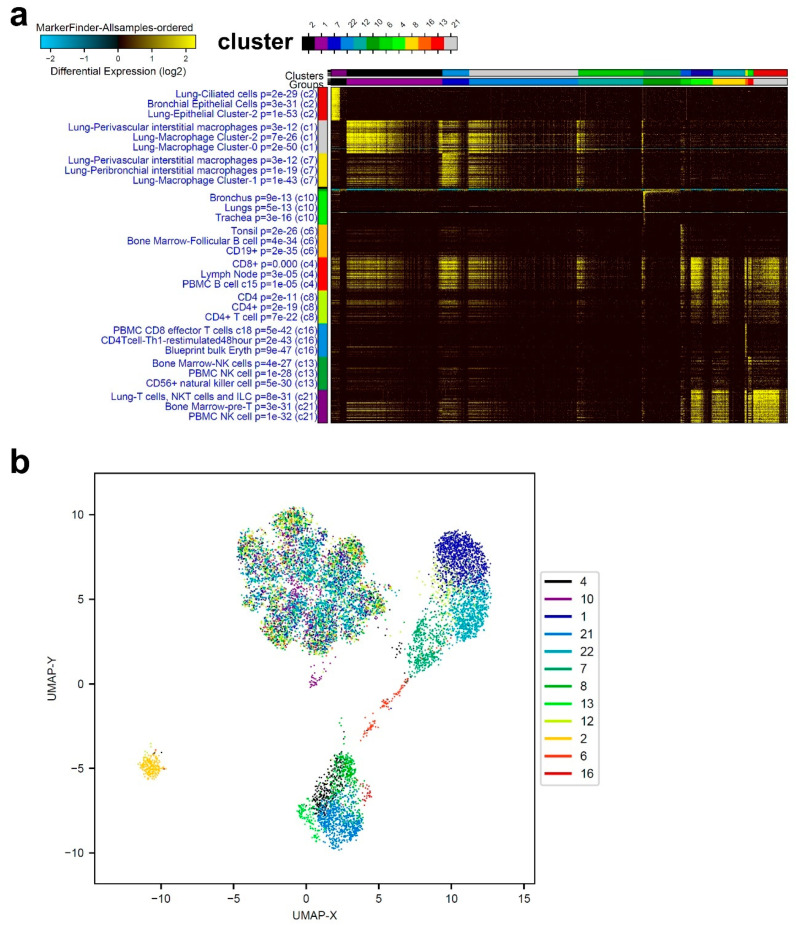
Figure 2.
Representative single-cell analysis of BAL from a mild COVID-19 patient. (a) Representative single-cell analysis of BAL from a mild-COVID-19 patient employing the ICGS2 algorithm depicted as heat map. (b) UMAP dimensionality reduction visualization of cell clusters corresponding to data presented in panel (a).

