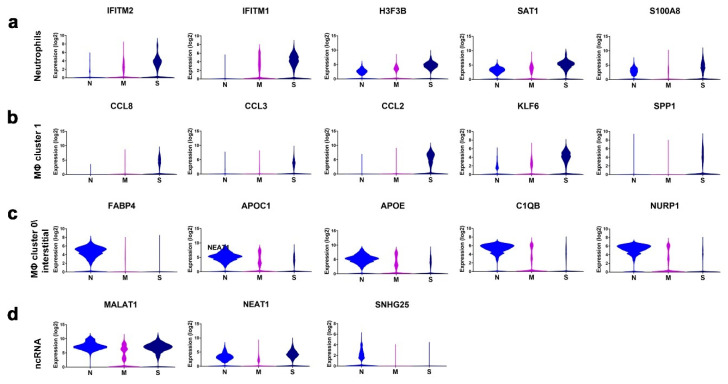
Figure 5.
Expression of enriched gene markers in patients with mild or severe COVID-19 compared to healthy subjects. Expression of gene signatures derived from neutrophils (a), macrophage (MΦ) cluster 1 (b), macrophage cluster 0/interstitial (c), and noncoding RNAs (ncRNA) (d) in a total of 68,873 single cells derived from two healthy subjects, three patients with mild COVID-19, and five patients with severe COVID-19. Data are presented as violin plots. N: control, M: mild, S: Severe. Statistical analysis revealed significant differences in gene expression (p ≤ 0.0001) when comparing S vs. M, S vs. N, and M vs. N for the indicated genes.

