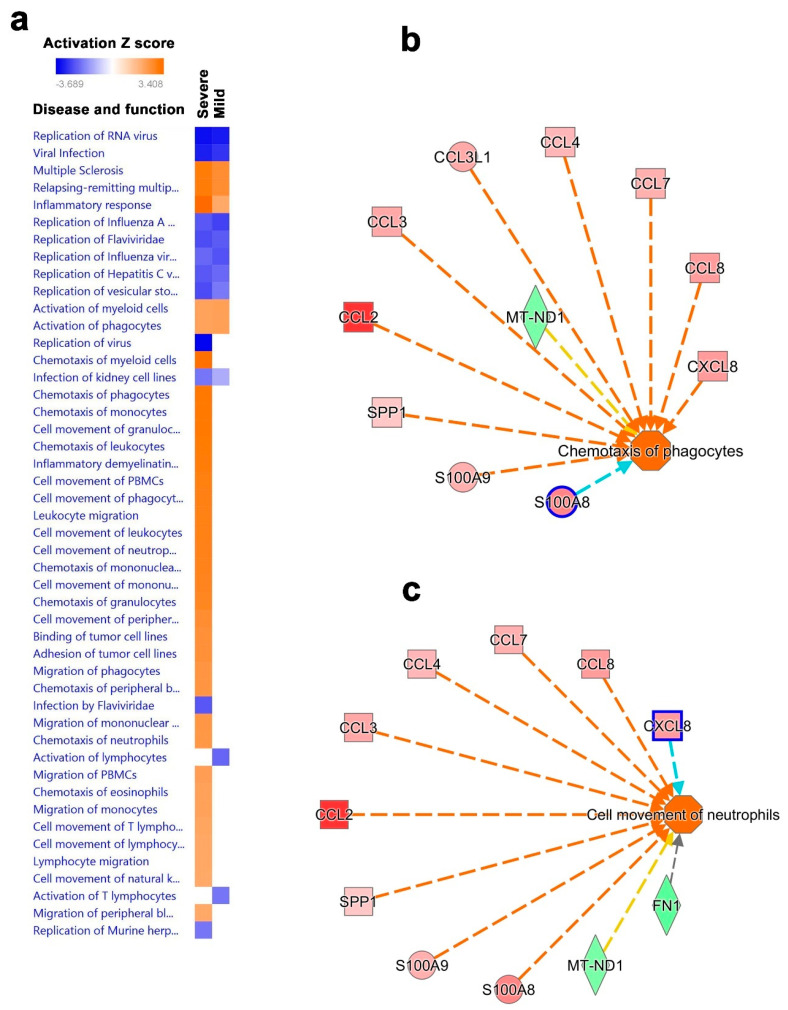
Figure 8.
Disease and functional analysis of differentially expressed genes in BAL from patients with mild and severe COVID-19. (a) Heat map depicting the activation states of the indicated disease and function categories in mild- and severe-COVID-19 BAL cells. Illustration of chemotaxis of phagocytes (b) and cell movement of neutrophils (c) in patients with severe COVID-19 based on IPA analysis.

