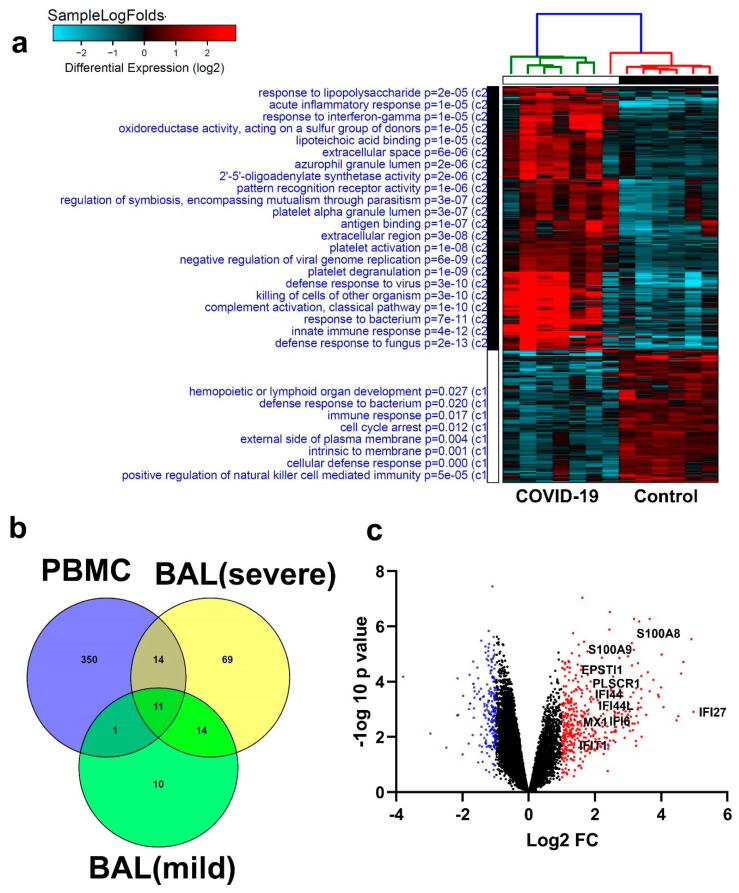
Figure 9.
Similarities in transcriptome data from BAL and peripheral blood mononuclear cell (PBMCs) in COVID-19 patients. (a) Hierarchical clustering summarizing differential gene expression (log2) in PBMCs from COVID-19 and normal controls, highlighting enriched functional categories (GO). (b) Venny diagram illustrating the aberrantly expressed genes in common in severe- and mild-Covid-19 BAL and PBMC, with 11 genes in common to the three categories. (c) Volcano plot depicting selected genes common to BAL and PBMCs, indicating upregulated (red) and downregulated (blue) genes.

