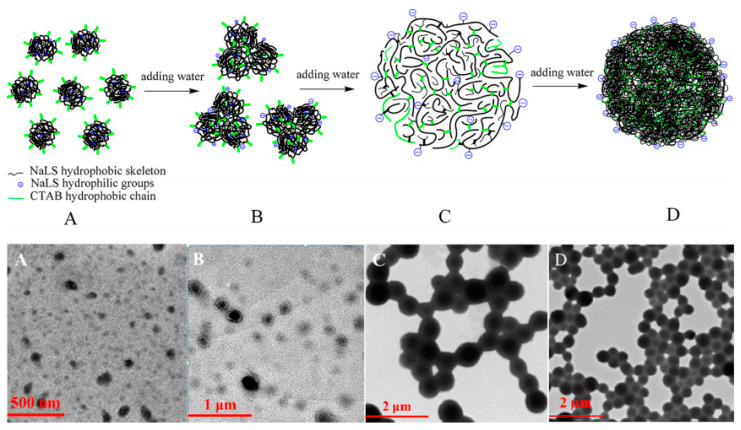
Figure 4.
The schematic diagram of the colloid formation process of the lignosulfonate/CTAB complex system in mixing solvents of EtOH and H2O and the TEM images of samples formed from the dispersions with various water contents: (A) 0; (B) 0–58 vol %; (C) 58–84 vol %; (D) >84 vol % [7]. Copyright © (2018) American Chemical Society.

