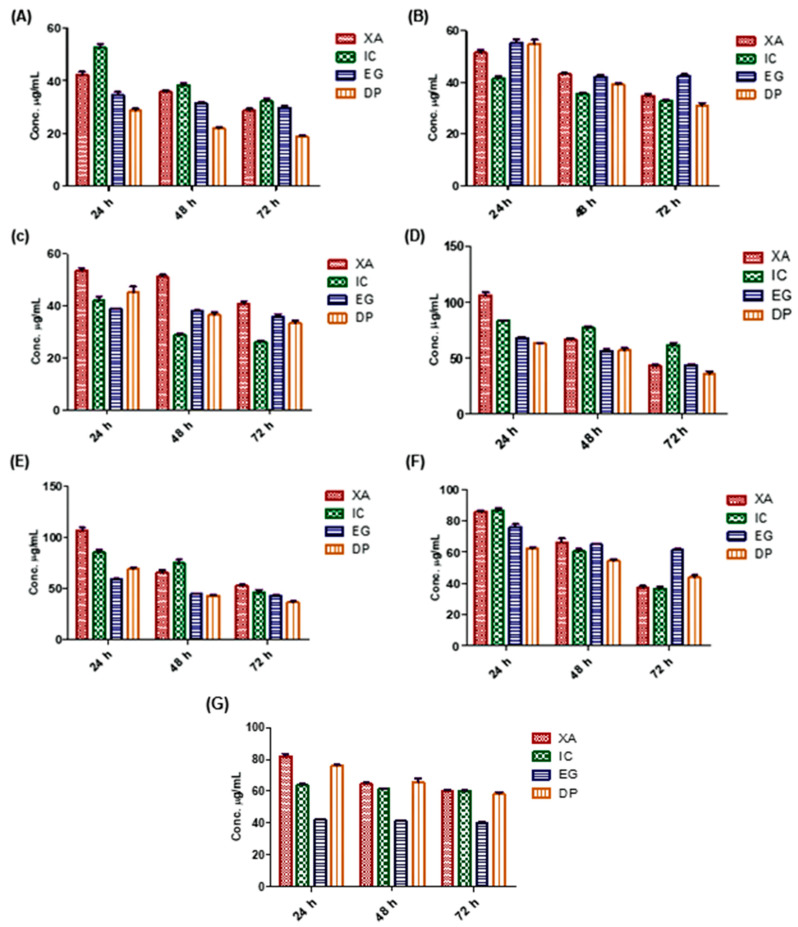
Figure 3.
The cytotoxicity effect of the studied plant extracts on different cell lines over 24, 48 and 72 h using MTT assay: (A) HeLa, (B) HepG2, (C) MDA-MB-231, (D) A549, (E) SK-OV-3, (F) U-87 and (G) HL60, (Y-axis: the concentration of IC50 in µg/mL). Values are mean ± SD of three independent experiments.

