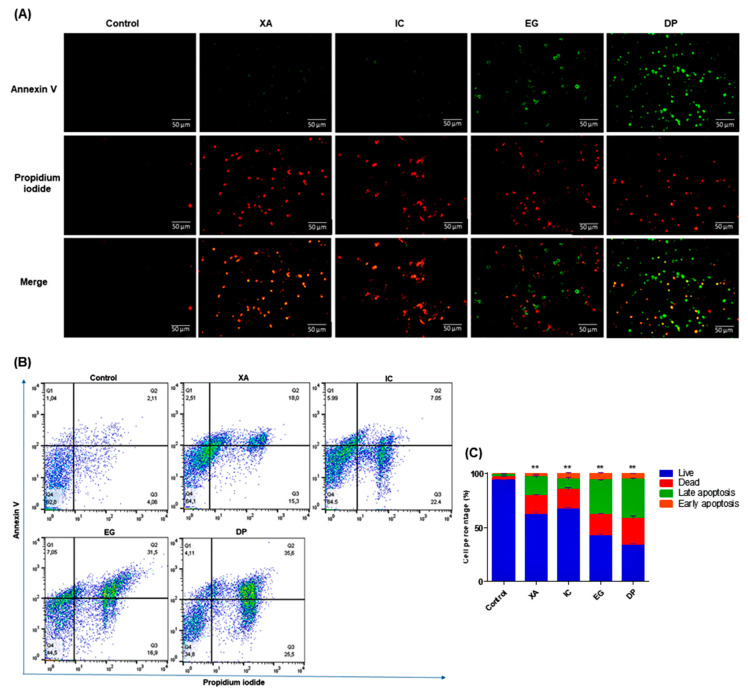
Figure 6.
Detection of apoptosis and necrosis using Annexin V-FITC and PI dual staining after 48 h of treatment of HeLa cells with IC50 of the studied crude extracts XA, IC, EG and DP in comparison to untreated cells. (A) Images by fluorescent microscopy represent one of the three independent experiments, (B) Results, after flow cytometry analysis, are expressed in the histogram as total percentages of cells from four different quadrants (Q1 = early apoptosis, Q2 = late apoptosis, Q3 = necrosis, Q4 = live), with mean ± SD of three independent determinations. All results are expressed in the histogram as total percentages of cells from four different groups with mean ± SD of three independent determinations. (C) Bar graph for values of cell percentages, expressed in mean ± standard deviation (SD) and analyzed using the one-way analysis of variance (ANOVA) at a significance level of p < 0.05 and indicated by **.

