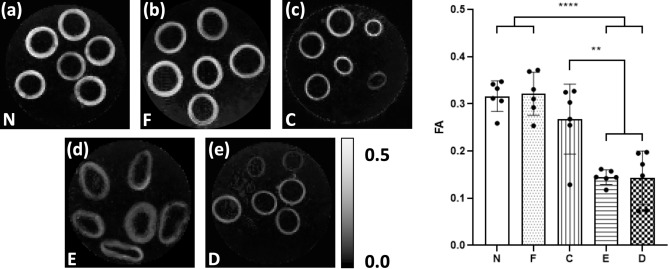
Figure 3.
Parametric maps of FA in a representative slice for each of the tissue models. As measured in vessel media, both (a) native (N) and (b) fixed native (F) PCaA showed significantly higher FA than both the (d) elastin degraded (E) and (e) decellularised (D) tissue models. (c) Collagen degraded PCaA also showed a significantly higher FA than both elastin degraded and decellularised PCaA. FA maps scaled to show 0 to 0.5 (**p = 0.0018 (C vs. E), **p = 0.0016 (C vs. D), ****p < 0.0001).

