
Figure 1.
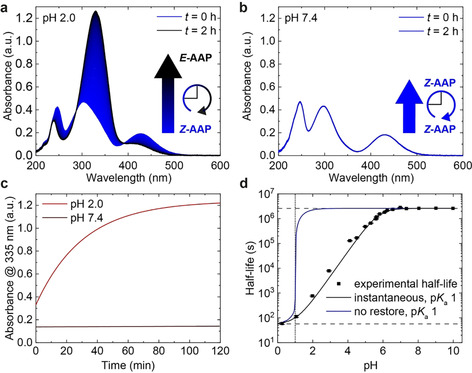
Half‐life of Z‐AAP as a function of pH. UV/Vis spectra of AAP were recorded at 20 °C over the course of two hours (a) at pH 2.0 and (b) at pH 7.4 after irradiation with 370 nm to the PSS. Time‐dependent data is based on 200 UV/Vis spectra. (c) Comparison of the thermal relaxation at pH 2.0 (red) and 7.4 (brown). The absorbance at 335 nm (A 335 nm) illustrates how fast the relaxation proceeds within two hours at the respective pH. While there is hardly any change at pH 7.4, Z‐AAP almost entirely relaxes back to E‐AAP at pH 2.0 in that time. (d) Thermal half‐life at 25 °C as a function of pH. The thermal half‐life is tunable over more than five orders of magnitude by adjusting the pH and features a sigmoidal dependence on the pH (black squares). The simulated half‐lives as a function of the pH are based on two assumptions [Eq. (8)]: no restore of P p(t) (blue curve) vs. constant ratio of P p(t)/P 0(t) (black curve). The model uses the experimental half‐lives τ 1/2 (pH>6.5)=2.60×10⁶ s (upper dashed line) and τ 1/2 (pH 0.3)=59.1 s (lower dashed line) as well as a numerically optimized pK a(Z) of 1 (dotted line).