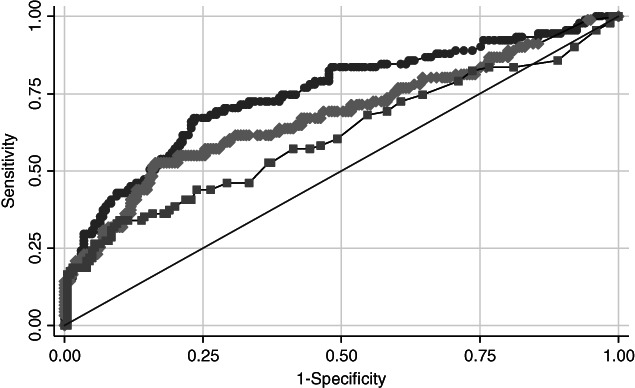
Figure 1.

Diagnostic performance compared between CA19‐9, CA12‐5 and CEA for the discrimination of borderline or malignant and benign mucinous ovarian tumor. ( ) CA‐125 ROC area: 0.7473. (
 ) CA19‐9 ROC area: 0.6793 (
 ) CEA ROC area: 0.6122. (
 ) Reference
