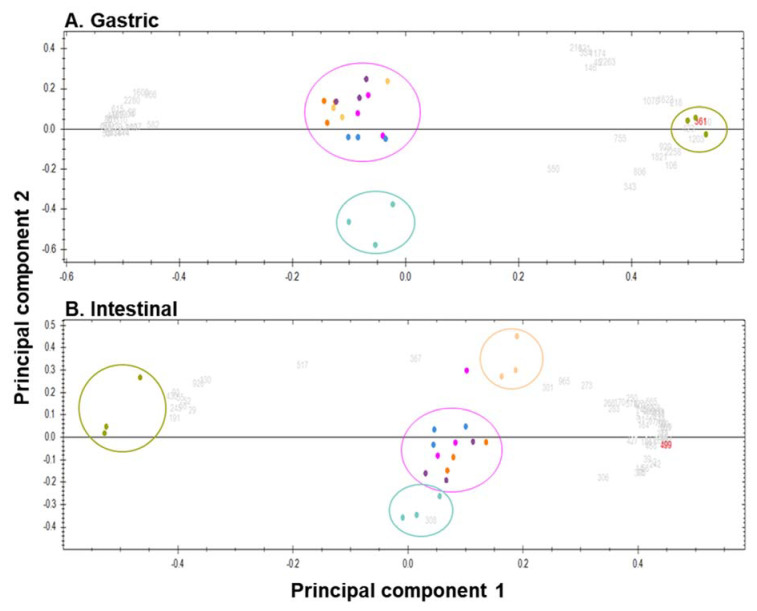
Figure 5.
Principal component analysis of the most relevant identified peptides detected at the end of the gastric (A) and intestinal (B) phases of the SGID: grey and red numbers correspond to the identified peptide displaying a mass signal intensity > to 1 × 10⁵ and an ANOVA p-value < 0.005. Color circles are hand-marked to facilitate understanding and have no statistical significance. C1, purple; C2, dark orange; C2 low Ca2+, light orange; C3, light blue; CW, dark blue; W, green; and QC, pink.

