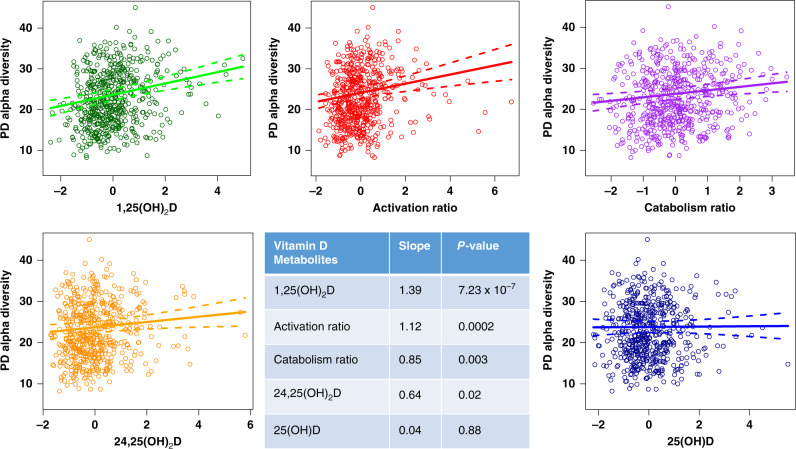
Fig. 3. Greater α-diversity is associated with higher 1,25(OH)2D levels and larger vitamin D activation and catabolism ratios.
Multiple linear regression of each of the vitamin D metabolites and their activation/catabolism ratios in association with microbial α-diversity. Covariates are set at their mean for continuous variables and level with largest sample size for categorical variables. Slopes are the estimated slope coefficients corresponding to each vitamin D metabolites in their multiple linear regression models, and p-values are obtained from the ANOVA F-test in multiple linear regression. Source data are provided as Source data file: “sourcedata_figure3.xlsx”.

