FIGURE 2.

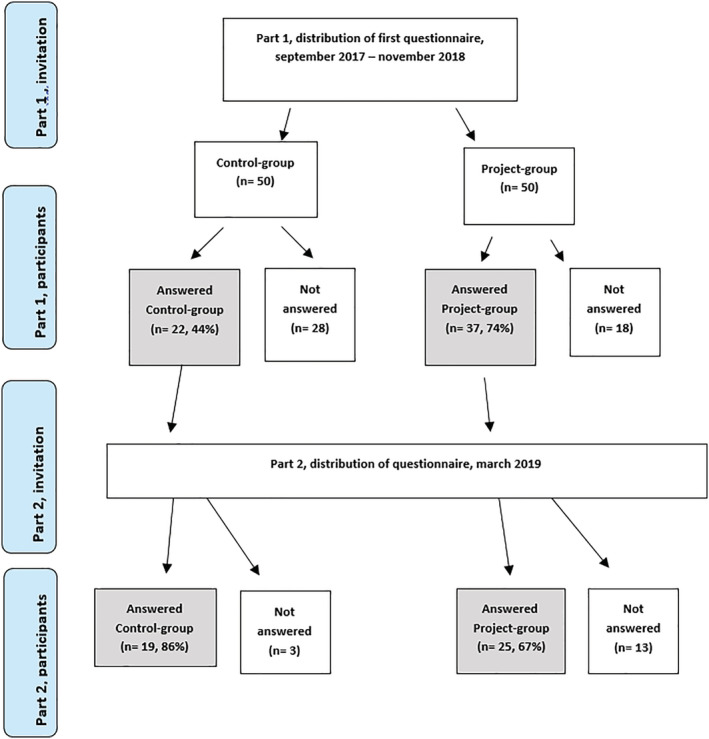
Flow‐chart of inclusion of patients in the evaluation of patient experiences [Color figure can be viewed at wileyonlinelibrary.com]

Flow‐chart of inclusion of patients in the evaluation of patient experiences [Color figure can be viewed at wileyonlinelibrary.com]