
FIGURE 2.
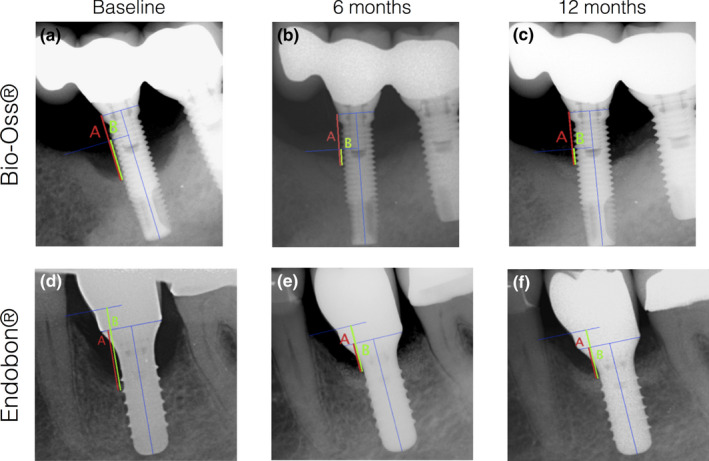
Radiographic assessment of: (a) bone level (red line) and (b) intrabony defect depth (green line) at baseline, 6 and 12 months after treatment at an implant treated with BO (a‐c) and EB (d‐f)
Official websites use .gov
A
.gov website belongs to an official
government organization in the United States.
Secure .gov websites use HTTPS
A lock (
) or https:// means you've safely
connected to the .gov website. Share sensitive
information only on official, secure websites.
Radiographic assessment of: (a) bone level (red line) and (b) intrabony defect depth (green line) at baseline, 6 and 12 months after treatment at an implant treated with BO (a‐c) and EB (d‐f)